New Data Identifies Forest Types Across the Globe
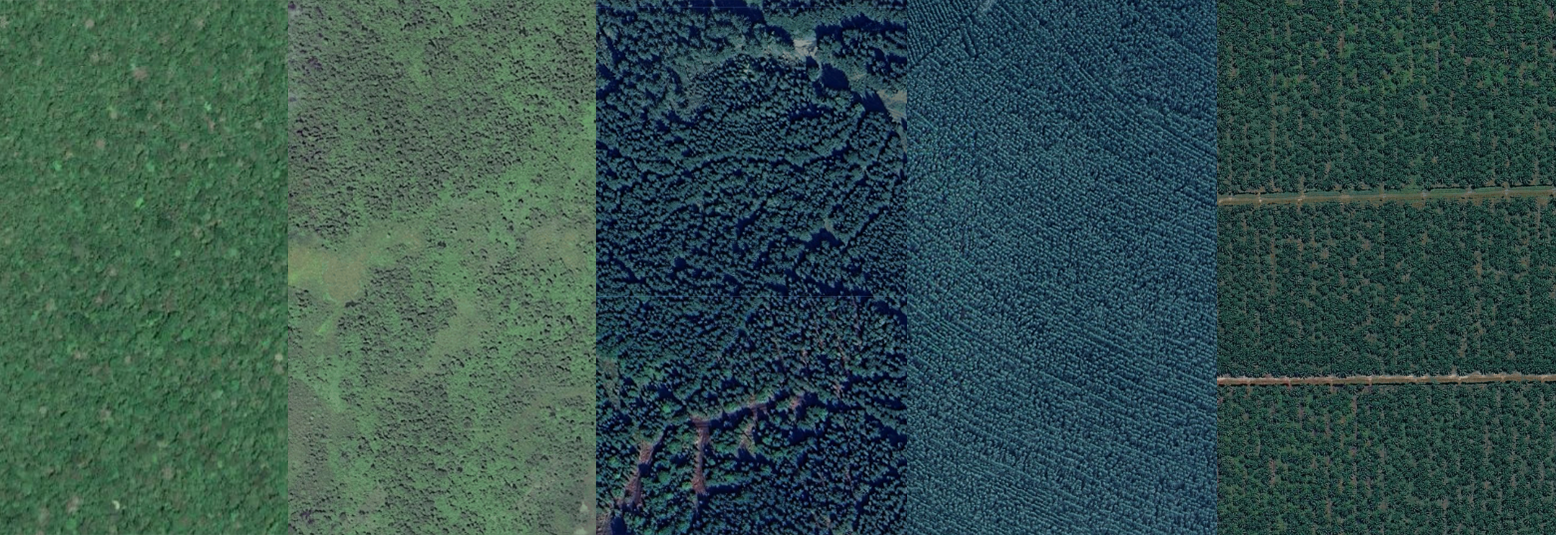
Different forest and tree cover types — such as primary forests, plantation forests (like eucalyptus plantations) and agricultural tree crops (like cacao and oil palm) — differ in terms of their biodiversity value, carbon density and importance to local communities.
As such, information on forest types is crucial for forest management and land use planning decisions, as well as for policy requirements such as monitoring compliance under the EU Deforestation Regulation (EUDR). Similar distinctions are needed for forest finance mechanisms like the Tropical Forest Forever Facility, which will pay countries for standing tropical forest, and for tracking progress toward global biodiversity targets.
Yet one of the most persistent challenges in satellite-based forest monitoring has been distinguishing these distinct types of forests and trees. Satellite-based systems often report tree cover, a biophysical measure of woody vegetation, because this metric can be easily observed from space. But not all tree cover is considered a forest according to commonly used definitions, and this metric does not distinguish between different forest types.
A new forest typology map, produced by Google DeepMind and Google Research in collaboration with WRI and the International Institute for Applied Systems Analysis (IIASA) using state-of-the-art methods, represents a major step forward by providing a detailed map of five major forest types globally at 10-meter resolution for the year 2020. It is the first global map at a high spatial resolution to distinguish between primary, naturally regenerating, planted and plantation forests, and agricultural tree crops, and is freely available under an open license.
What does the forest typology data show?
The forest typology map provides globally consistent information on the extent of forest types around the world.
The global 2020 map identifies six classes that align with the Food and Agriculture Organization of the United Nations (FAO) definitions, which are also referenced by the EUDR. FAO defines forest as land spanning more than 0.5 hectares with trees taller than five meters and a canopy cover of more than 10%, excluding land that is predominantly under agricultural or urban land use. Within this definition of forest, the map has five tree-based classes that are distinguished by land use, management intensity and rotation period, and also includes a sixth class encompassing all other land cover.
How was the data developed?
We developed the global forest typology map using a deep learning model whose primary input was Google’s AlphaEarth Foundations (AEF) embeddings. AEF embeddings are annual numerical representations of the Earth’s land surface derived from multiple sources of satellite data (including optical and radar) at 10-meter resolution.
The model was trained on approximately 1.7 million samples collected by experts and derived from regional datasets on tree crops, plantations and other global and regional maps. Model training was conducted in three stages, each building on the previous one:
Stage 1: Training on expert-annotated data
In the first stage, the model was trained on nearly 450,000 curated, high quality labels that were harmonized to align with forest typology categories. Most of the labels describe the dominant class within roughly 100 x 100-meter areas.
Stage 2: Large-scale training
The next stage scaled training to 1.2 million samples globally with more detailed labels, while building on what the model learned during the first phase. Each training sample was a 1280 x 1280-meter densely labeled patch at 10-meter resolution, meaning that each 10-meter pixel within a patch had a label. The labeled patches were created using the class probabilities from the first model refined with other global and regional datasets.
Stage 3: Temporal calibration
The third stage improved the temporal consistency of the model and reduced noise. In this stage, training labels were generated for 2019-2024 with the class probabilities from the second model refined with ancillary data on forest change. AEF embeddings for all years from 2019-2024 were used as model inputs, allowing the model to use context from neighboring years while reflecting recent forest changes.
In each of these stages, an active learning workflow was implemented to improve map quality in underrepresented regions and for challenging classes. Experts visually inspected the maps to identify errors and collected targeted additional training labels to improve the forest type prediction.
To assess the accuracy of the map, we collected an independent stratified random sample of reference labels. We found that the overall accuracy of the map is 90.2%, with the highest accuracies for the primary, naturally regenerating forest, and other classes.
As with all large datasets, there are some limitations. Because the class definitions are aligned with FAO definitions that rely on management intent and history, which is not always directly observable from satellite imagery, the model relies on proxies such as spectral characteristics, canopy structure and spatial context to distinguish the classes. As a result, there is uncertainty at class boundaries, such as mature secondary forests that appear similar to primary forests from space. Similarly, the relatively lower accuracy for the planted forest class reflects the challenge of distinguishing this class from both naturally regenerating forest and plantation forest. Shaded agroforestry systems, such as cacao or coffee grown under a native canopy, may be mapped as natural forest in some regions.
Explore the publication for more information on the methodology, accuracy and limitations.
How can the data be used?
Being able to distinguish between forest types is an important factor for effective forest protection and sustainable management. Specific ways the forest typology data can be used to support these efforts include:
- Prioritizing areas for protection: The map can support the identification of areas where remaining primary and naturally regenerating forests should be prioritized for protection to meet biodiversity targets, such as the Kunming-Montreal Global Biodiversity Framework Target to conserve and effectively manage 30% of the world’s land (the 30×30 target).
- Baseline for monitoring forest loss and gain: The map can be used as a baseline and combined with various forest monitoring datasets, such as tree cover loss and gain data available on Global Nature Watch, to provide more detailed insights on forest loss and gain dynamics. We explored this use case in an initial analysis — see some of our global results below.
- Supporting deforestation-free supply chains: The EUDR uses the year 2020 as a baseline and treats tree crop plantations and agroforestry as agricultural land rather than forest. The forest typology map helps users check whether a production area was natural forest at the end of 2020 or was already converted to agricultural tree crops. Under the EUDR, the conversion of primary or naturally regenerating forest into plantations and the conversion of primary forest to planted forest are considered forest degradation, so knowing the forest type in 2020 is a first step toward monitoring compliance.
Adapt the map to your specific needs
Because the data includes per-class probabilities, users can adapt the map to their needs by using custom probability thresholds. Using a higher probability threshold for a class gives more confidence that mapped areas are truly of a given type. The class probabilities are relative confidence scores rather than calibrated probabilities, so local validation is recommended for important management decisions about individual farms or concessions.
Access the data
The data is available on Google Earth Engine and can be downloaded here. In the coming weeks, the data will be available to view and analyze on Global Nature Watch Horizon, our AI-powered platform in preview.
The data is provided as a global raster, with bands representing class probabilities. These probabilities can be combined to form the categorical forest type map. Forest type classes can also be combined as needed — for example, into natural forest and all other lands.
What is the data revealing about forest change and what’s next for forest typology mapping?
To explore what the forest typology map can tell us about forest change, we combined the map with tree cover loss and gain data. This analysis starts to reveal new insights about forest loss and recovery dynamics globally.
We found that globally from 2021-2025, the majority (71%) of loss occurred in primary and naturally regenerating forests, although this varies substantially by region. This distinction can help separate wood harvest and management in managed forest types (planted or plantation forests and tree crops) from natural forest loss.
Similarly, distinguishing forest types can help us understand the nature of forest regrowth and gain, separating the establishment and regrowth of plantations from natural forest recovery. We found that globally from 2000-2020, the majority (72%) of new tree cover gain (areas that had tree cover in 2020 but no tree cover in 2000) largely represents regrowth of natural forest. Similarly, the majority (73%) of regrowth following a disturbance in the period between 2000 and 2020 represents natural forest regeneration.
These findings are a first step in applying the forest typology map to understand what types of forests are being lost and gained around the world and why.
In the next phase, the team that produced the 2020 map is developing annual maps for the period from 2017-2025 and beyond, which are currently available as a beta version under early release. These maps are preliminary and are subject to change as the team works to improve them. Ultimately, they will allow for more flexibility when using the map as a baseline for various monitoring objectives and will also enable monitoring changes between forest types across years.
The forthcoming annual maps represent an important component in a suite of new forest monitoring products we’re developing that will enable more robust and comprehensive forest monitoring. Stay tuned for future updates!